Flask Charts via amCharts, G.Charts, and ApexCharts (with sample)
Sample project crafted with Flask, Flask-RestX and multiple Charts Libraries to showcase how to plot different charts Pie, Line and Bar Charts.

Hello! This article presents an open-source sample crafted with Flask, Flask-RestX, and a few popular JS libraries used to showcase analytics using different charts: Pie, Line and Bar Chart. This sample aims to help beginners to understand all layers involved in this simple data analytics use case - Source Code published on Github. Thanks for reading!
- 👉 Multiple Charts via Flask-RestX - Source Code
- 👉 Multiple Charts via Flask-RestX - LIVE Demo
- 👉 Free Support via Email and Discord.
✨ How to use it
The product can be used by following a few build instructions provided in the README file, shipped with the sources. Curious minds can use this simple starter in a local environment by typing a few commands in the terminal, without leaving this page.
👉 Step #1 - Clone sources
$ git clone https://github.com/app-generator/sample-flask-charts-multiple.git
$ cd sample-flask-charts-multiple
👉 Step #2 - Install Modules using a virtual environment$ virtualenv env
$ source env/bin/activate
$ pip3 install -r requirements.txt👉 Step #3 - Set up the environment
$ export FLASK_APP=run.py
$ export FLASK_ENV=development
👉 Step #4 - Load Sample Data from data directory$ flask load-data 👉 Step 5 - Start the APP
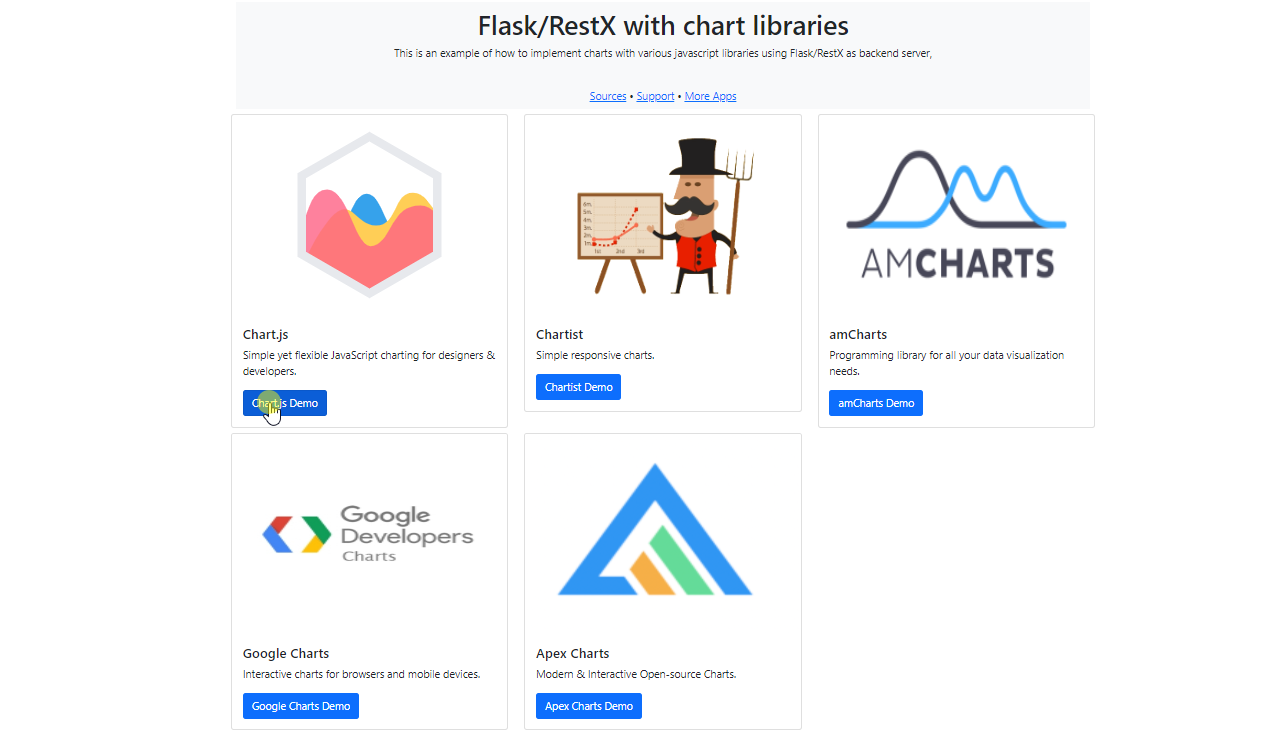
$ flask runOnce all the above commands are executed, we should see this Flask sample running in the browser. Each JS library is linked from the project HOMEpage as we can see below:
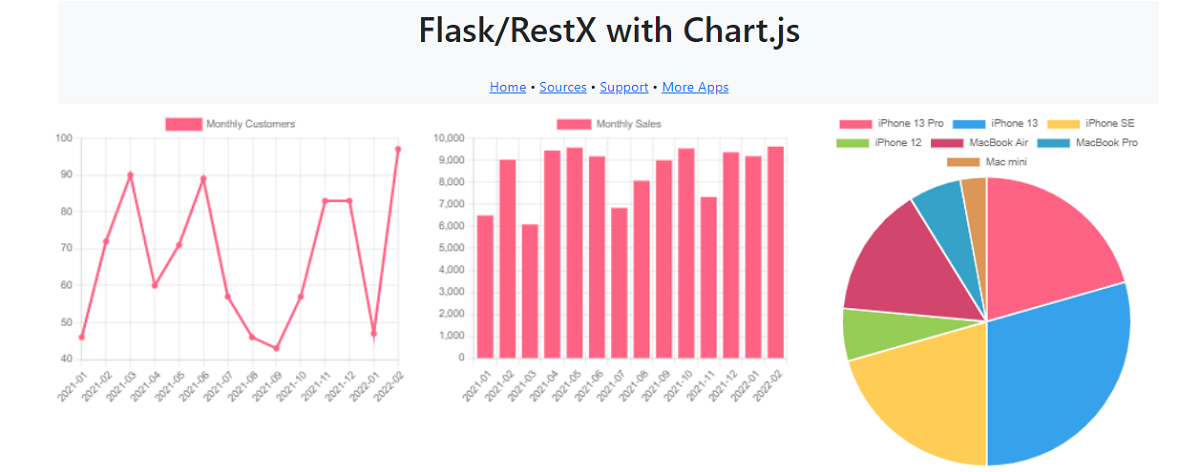
✨ Chart.js
Chart.js is a Simple yet flexible JavaScript charting for designers & developers.
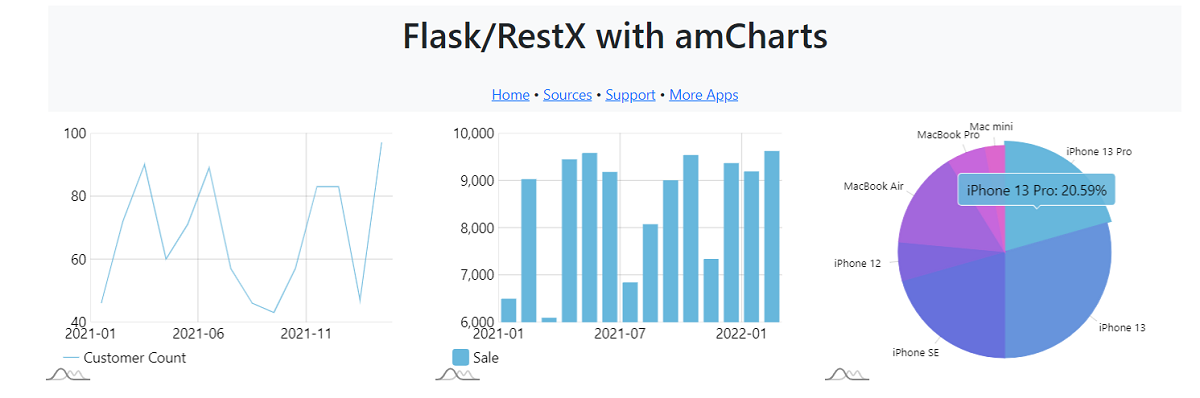
✨ amCharts
Programming library for all your data visualization needs.
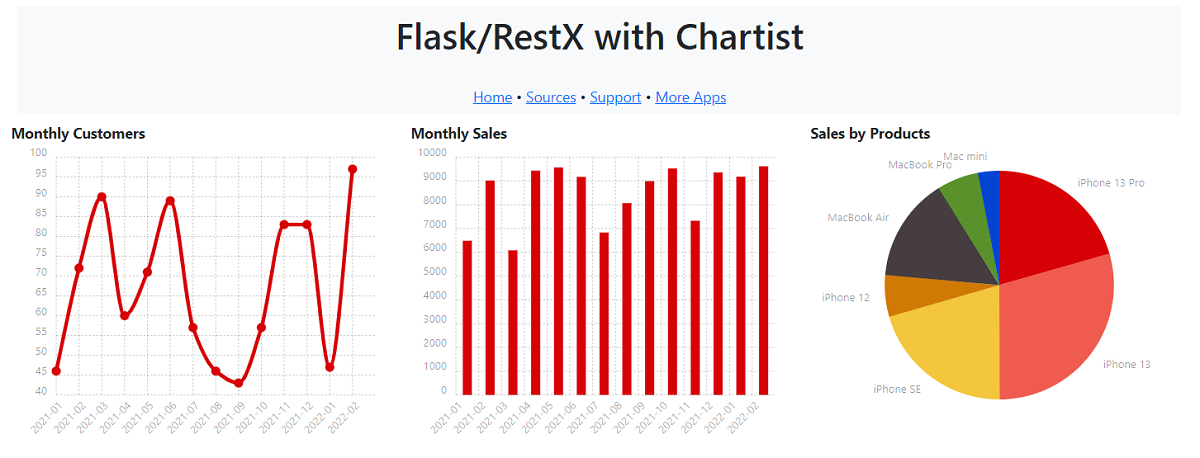
✨ Chartist
Open-Source Library for coding simple & responsive charts.
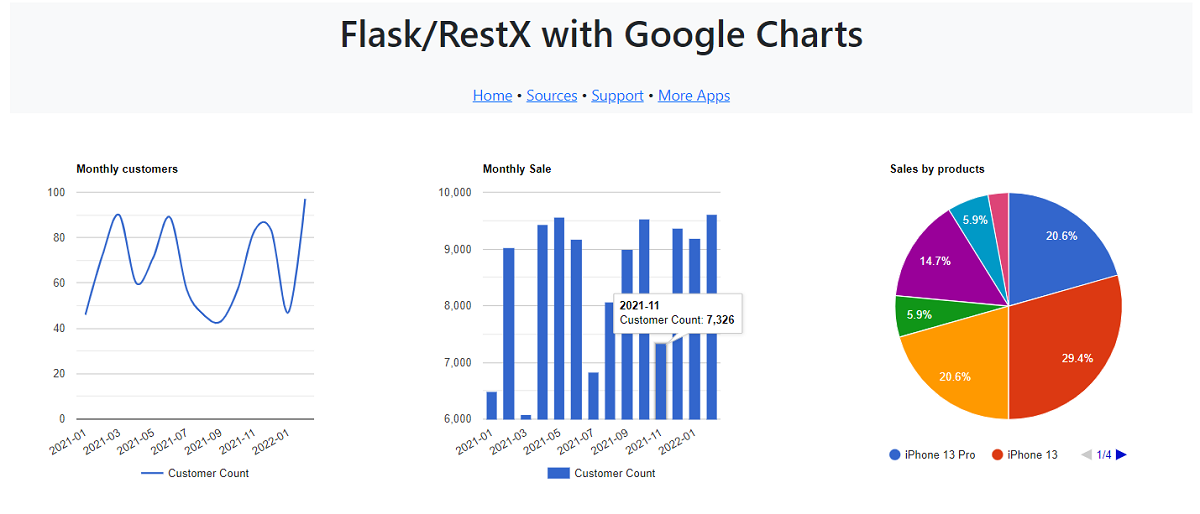
✨ Google Charts
Google chart tools are powerful, simple to use, and free. Try out our rich gallery of interactive charts and data tools.
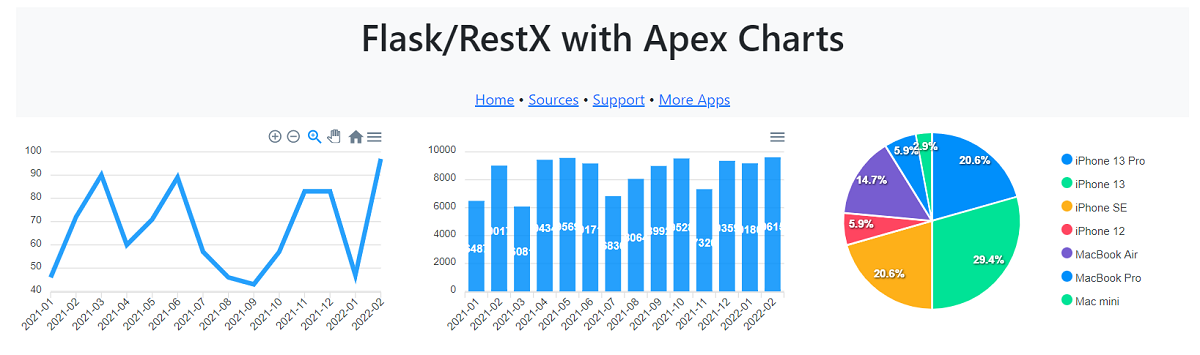
✨ ApexCharts
Modern, Interactive Open-Source charts
Thanks for reading!