Django Charts via amCharts, G.Charts, and ApexCharts (with sample)
Sample project crafted with Django, DRF, and multiple Charts Libraries to showcase how to plot different charts Pie, Line, and Bar Charts.


Hello! Having an API helps your data be available to multiple sources. This means that many requests from different sources or exploited by many scripts on the same server. In this article, we’ll be building a web page to display data using many JS chart libraries such as Chart.js, Chartist, AmCharts, Google Charts, ApexCharts using Django as the backend framework. Thanks for reading!
- 👉 Multiple Charts via Django & DRF - Source Code
- 👉 Free Support via Email and Discord.
✨ Setup the project
The base of the project has already been set up and you just need to clone a repo to get started.
It’s a Django project coming with an API, data that can be loaded in the database, and the Chartjs already configured and loaded. You can check the article about it here:
Django Charts via DRF and Chart.js (codebase explained)
👉 Clone the project with the following command:
$ git clone https://github.com/app-generator/sample-django-charts-multiple.git
$ cd sample-django-charts-multiple
👉 Install Modules using a Virtual Environment
$ virtualenv env
$ source env/bin/activate
$ pip3 install -r requirements.txt
👉 Migrate/Set Up Database
$ python manage.py migrate
$ python manage.py runserver
👉 Create Superuser
$ python manage.py createsuperuser👉 Start the App
$ python manage.py runserver✨ The bootstrap flow
- Access the
adminsection - Load
data/users.csvin users table (using import/export feature) - Load
data/products.csvin users table (using import/export feature) - Access the HOMEpage
- Charts should be displayed with data
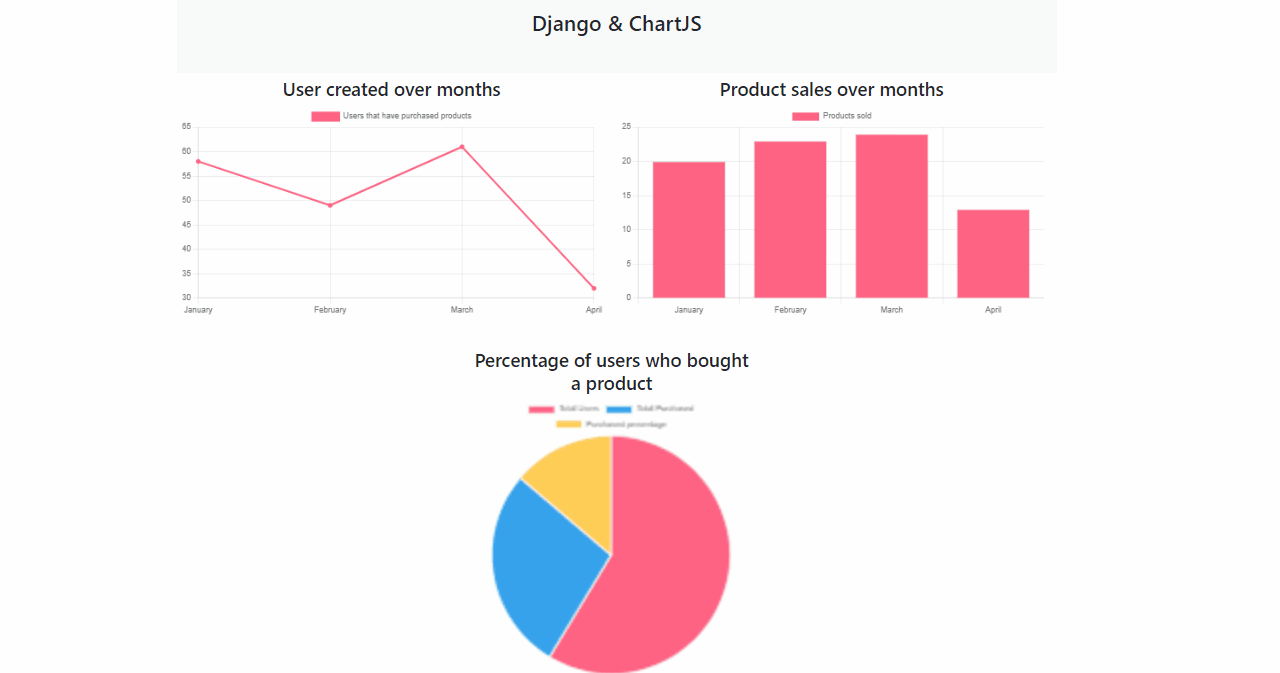
✨ Chart.js
Chart.js is a Simple yet flexible JavaScript charting for designers & developers.
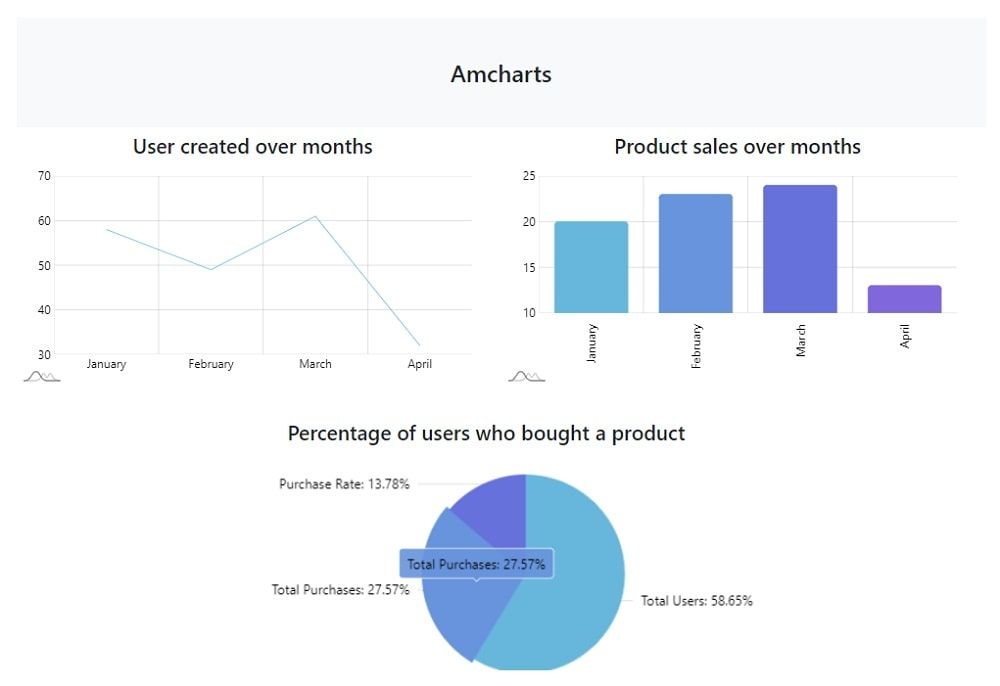
✨ amCharts
Programming library for all your data visualization needs.
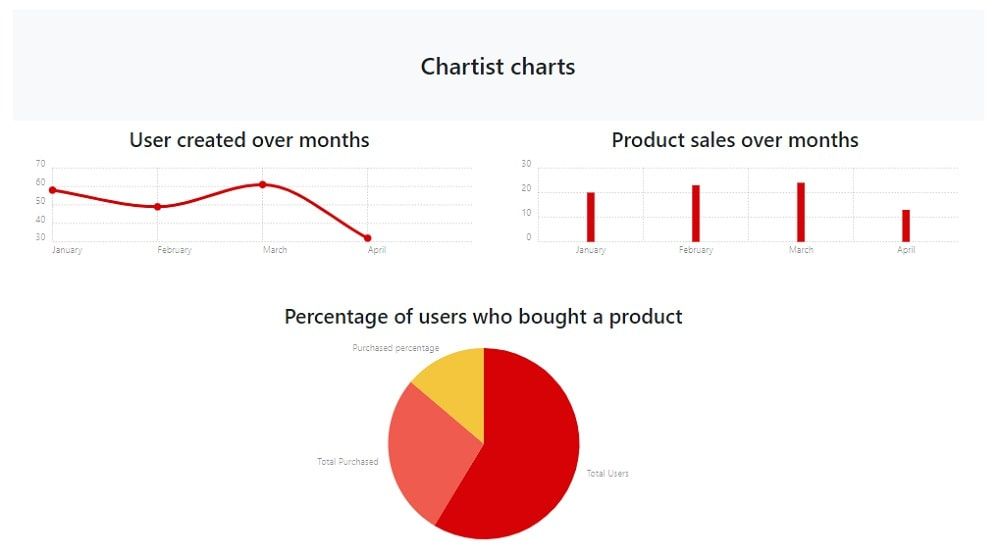
✨ Chartist
Open-Source Library for coding simple & responsive charts.
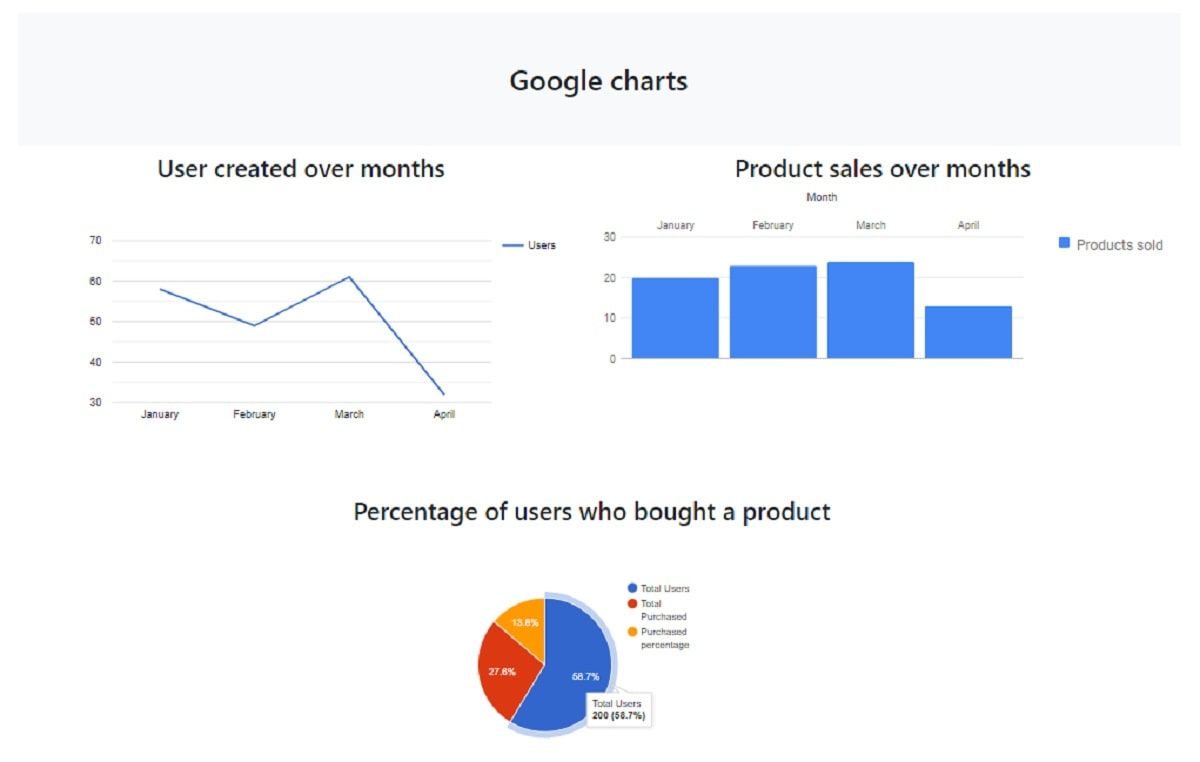
✨ Google Charts
Google chart tools are powerful, simple to use, and free. Try out our rich gallery of interactive charts and data tools.
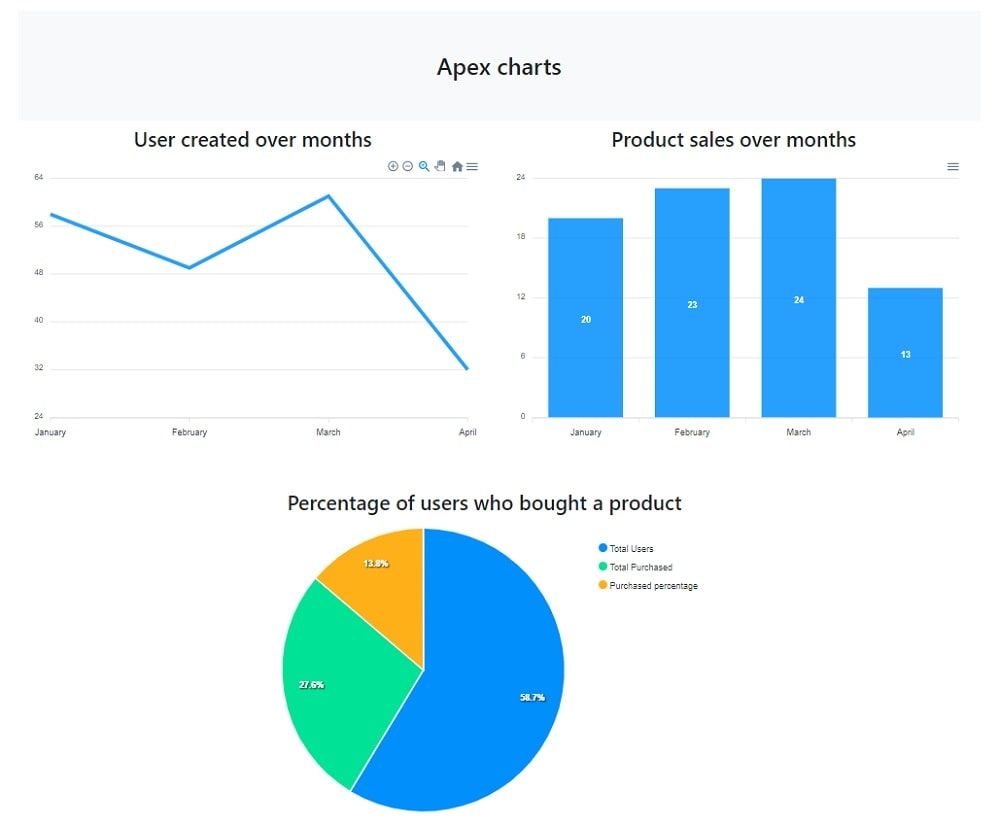
✨ ApexCharts
Modern, Interactive Open-Source charts.
Thanks for reading!